Oct 28 - Oct 29, 2012
|
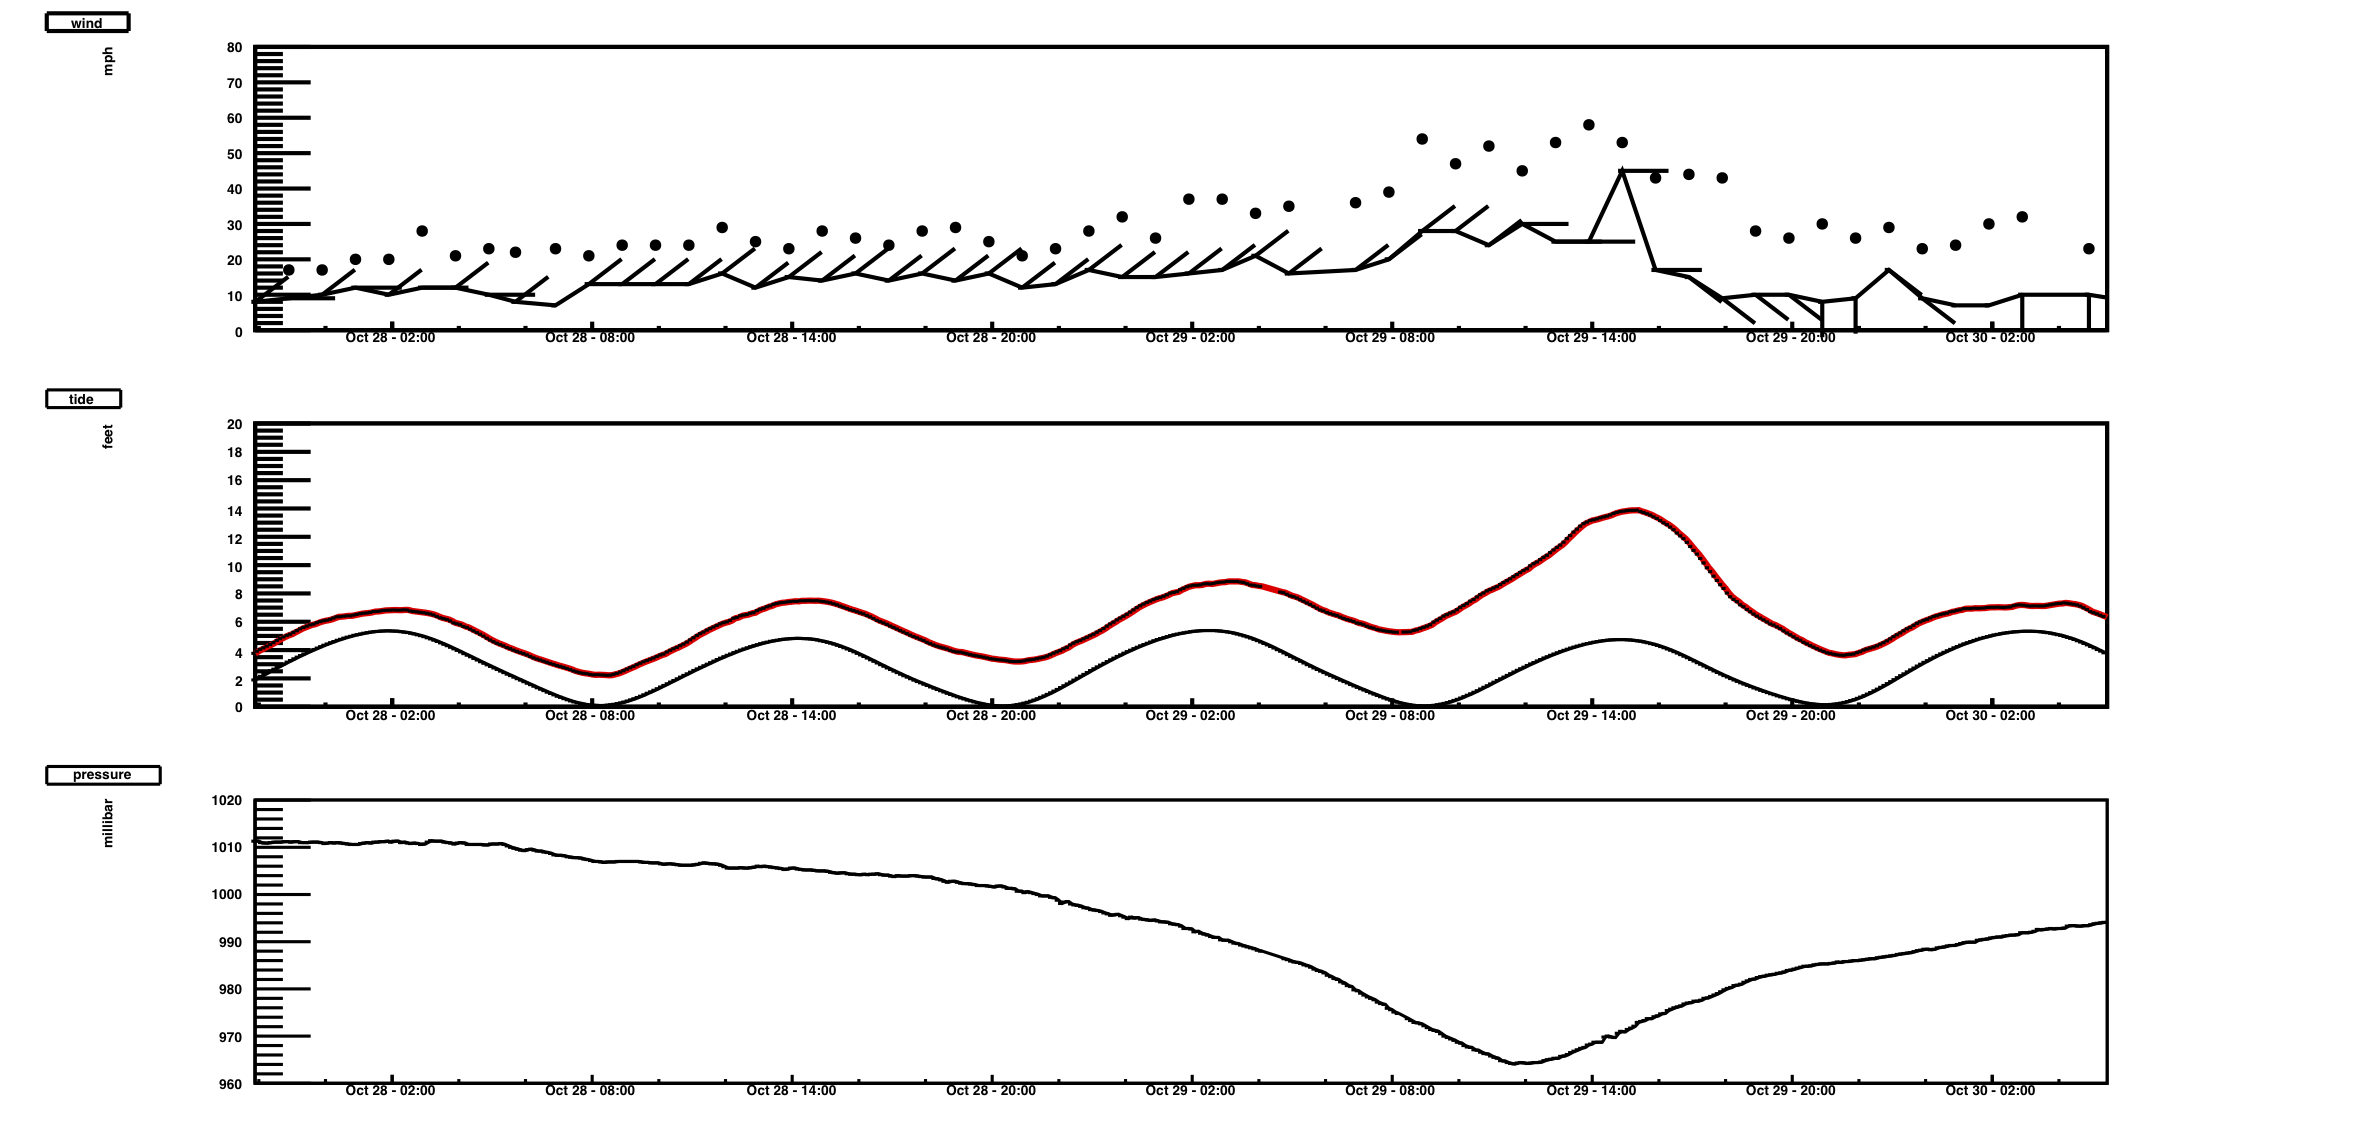
Top Plot - Wind Data is from Central Park. Line is the hourly average wind speed. The staff on each point is the direction of the wind. The circular points are gust. Data is in mph (miles per hour).
Middle Plot - Water Level/Tide
Bottom Plot - Air Preassure |