- race date - coolrunning & NYRR
- AG curves
- world record / age & gender group
click on figure to get full size
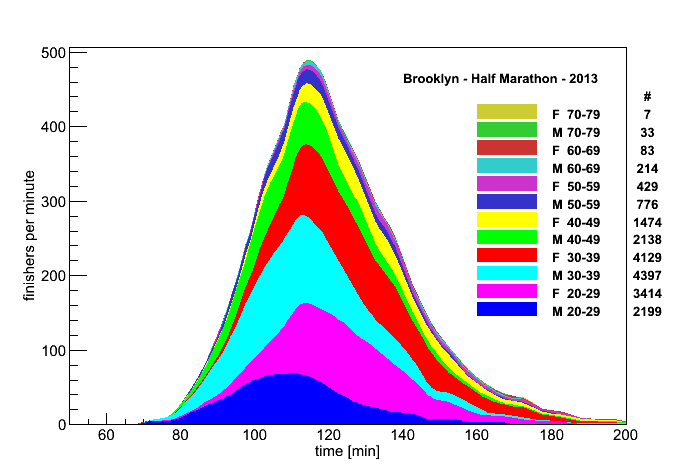
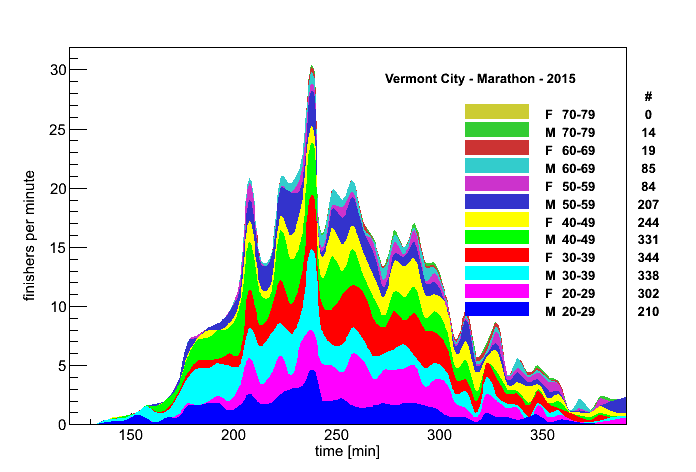
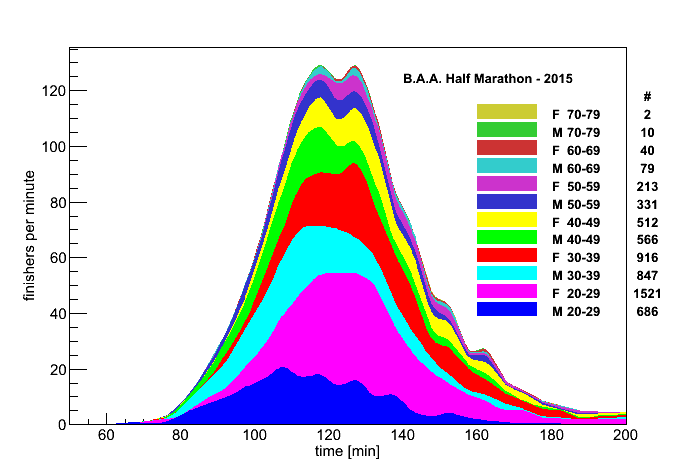
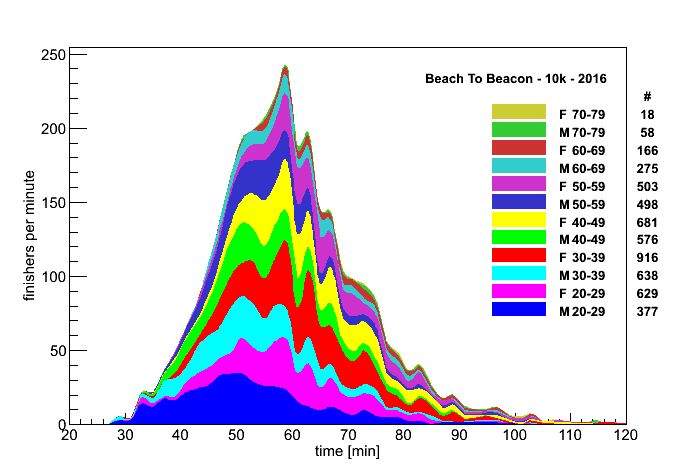
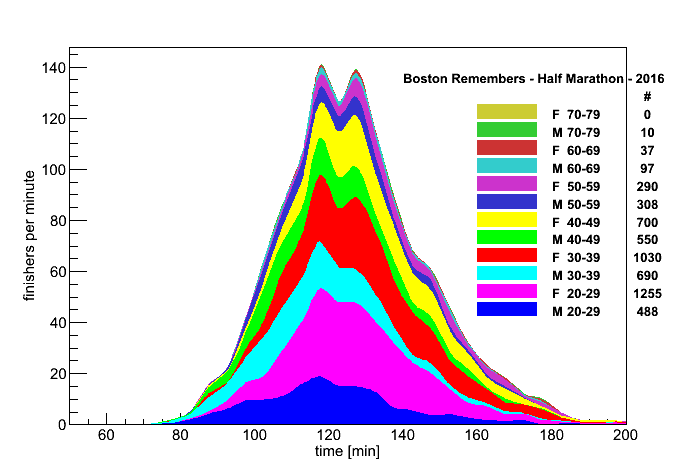
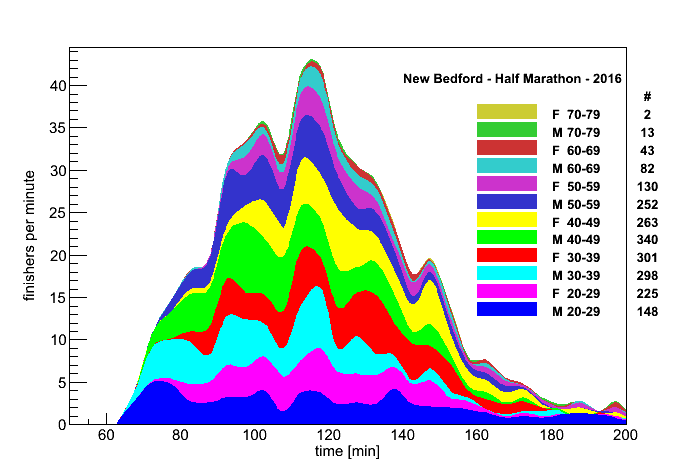
Fig 1. The Profile of the Brooklyn Half Marathon
The number of runners finishing each minute as a function of time. Each band is a different age and gender group.
for high resolution, *pdf version click here
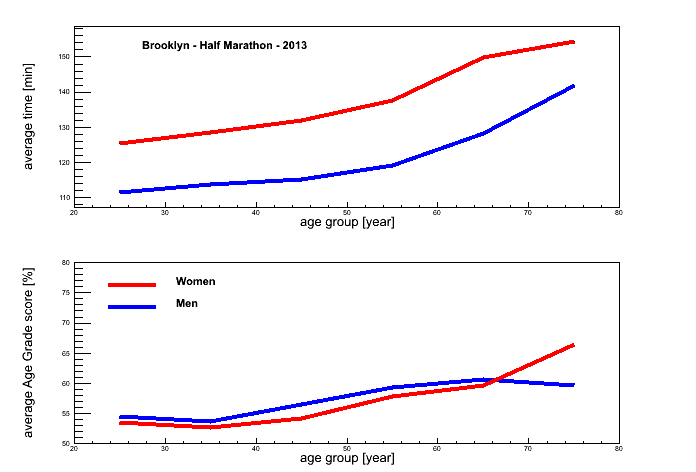
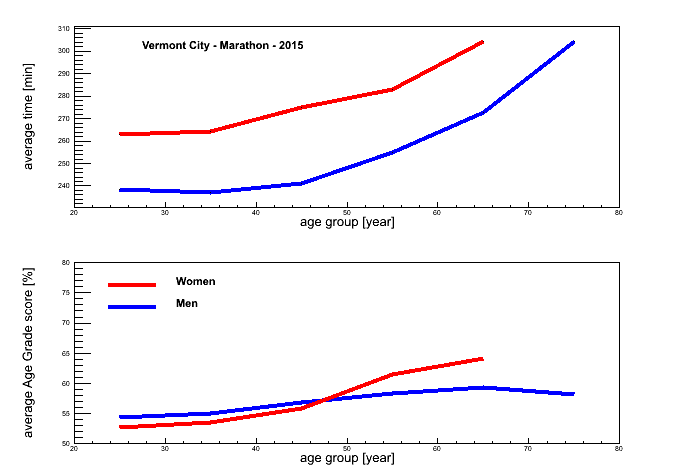
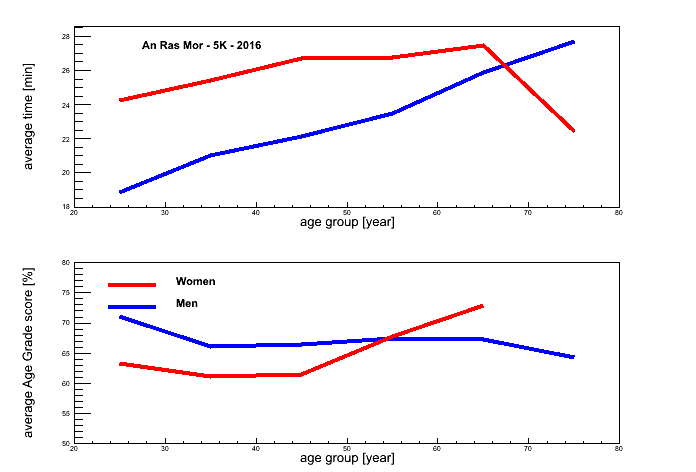
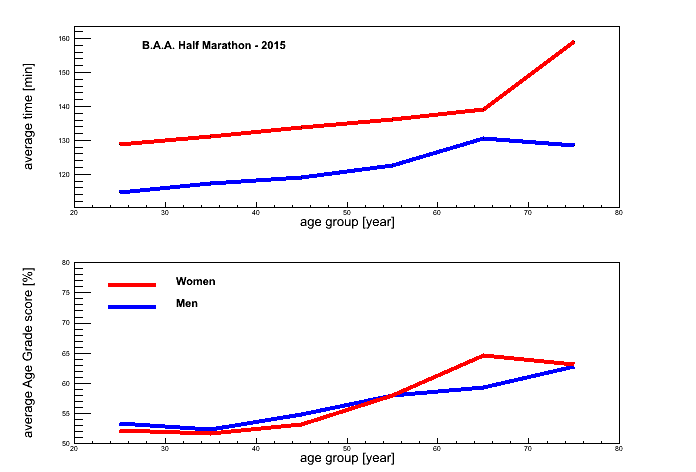
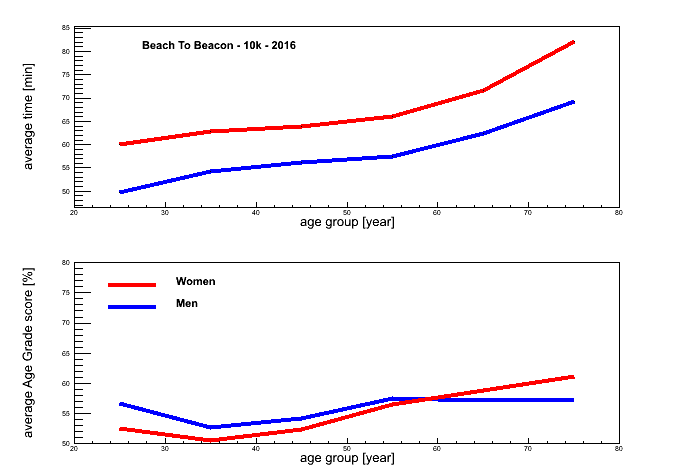
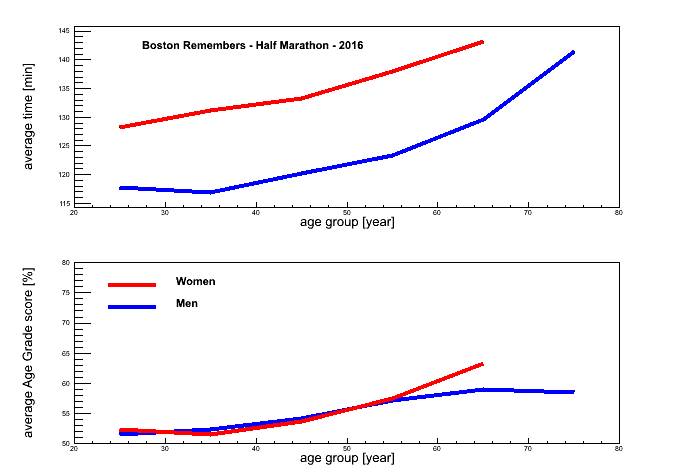
Fig 2. (top) Average time for everyone in an age group as a function of age.
(bottom) Average Age Grade score in an age group as a function of age.
Where as runners do get slower as they age, there AG scores actually get better over time.
for high resolution, *pdf version click here
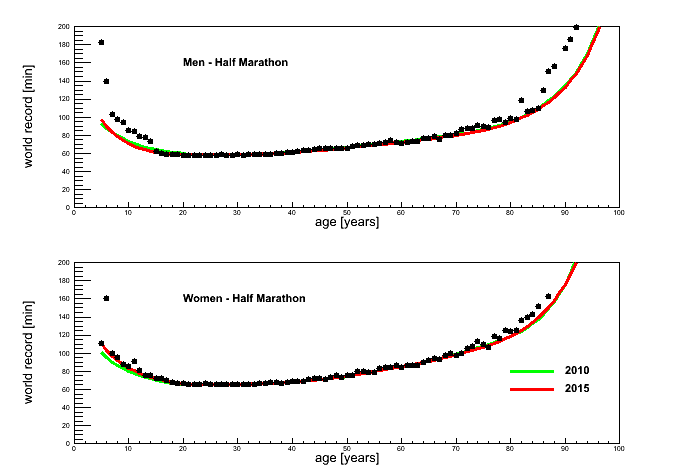
Fig 3. World Records by age and gender for the Half Marathon.
The curves are the standards used for Age Graded scoring.
for high resolution, *pdf version click here
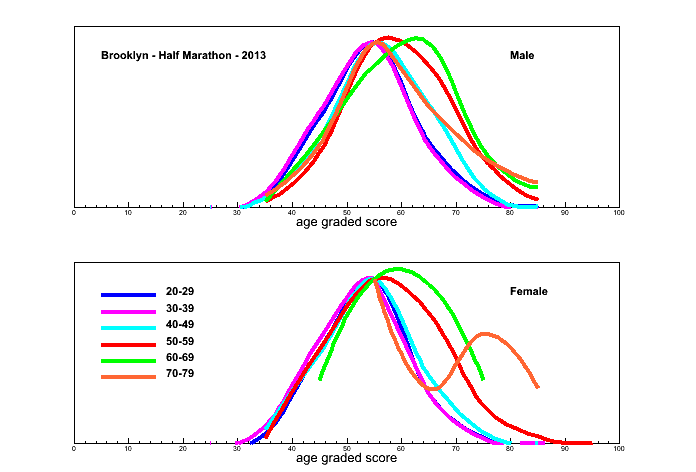
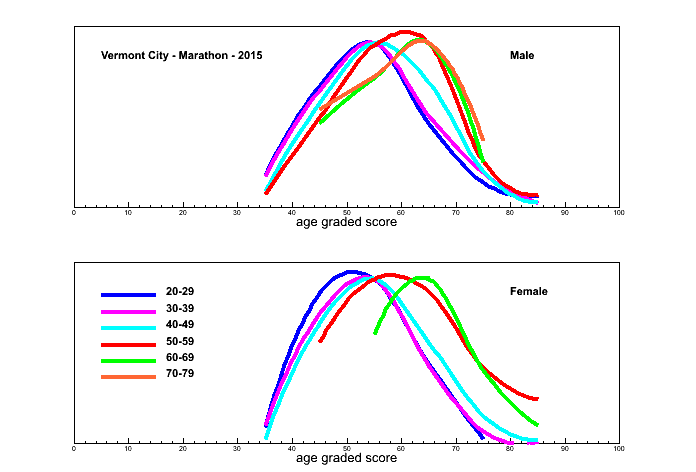
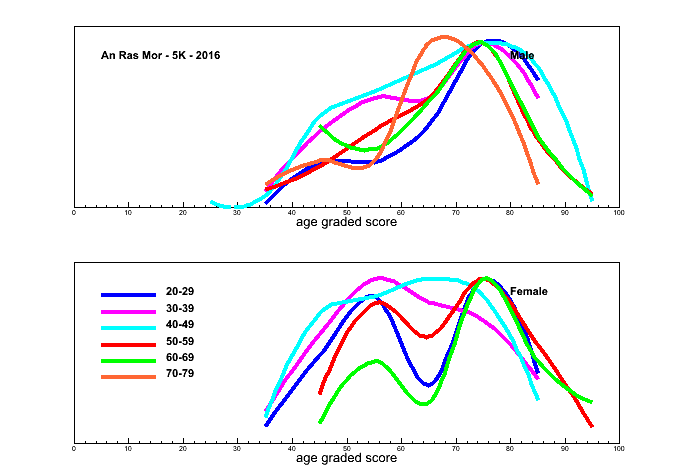
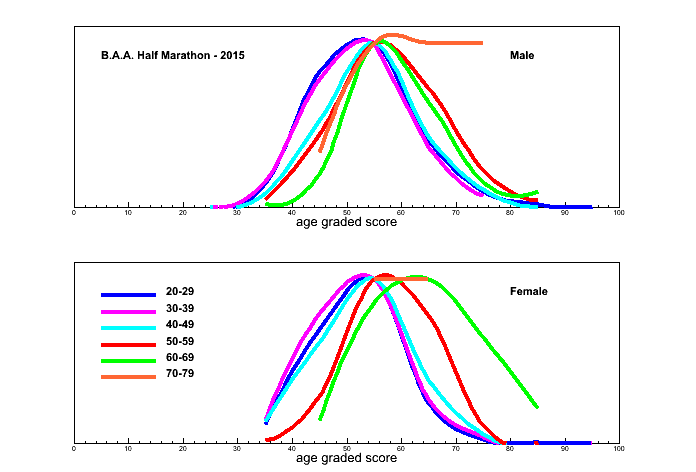
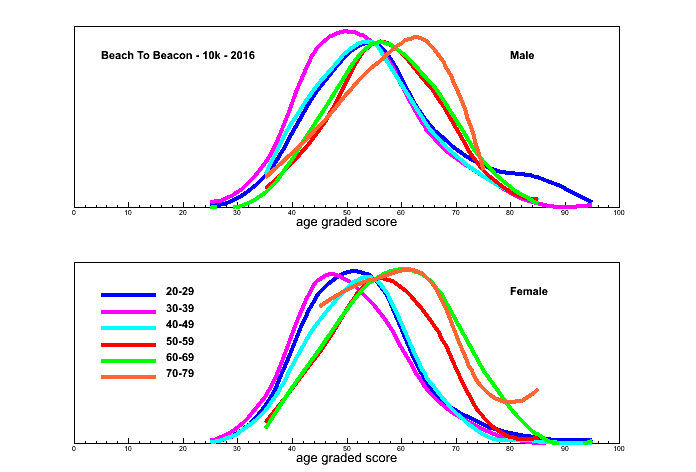
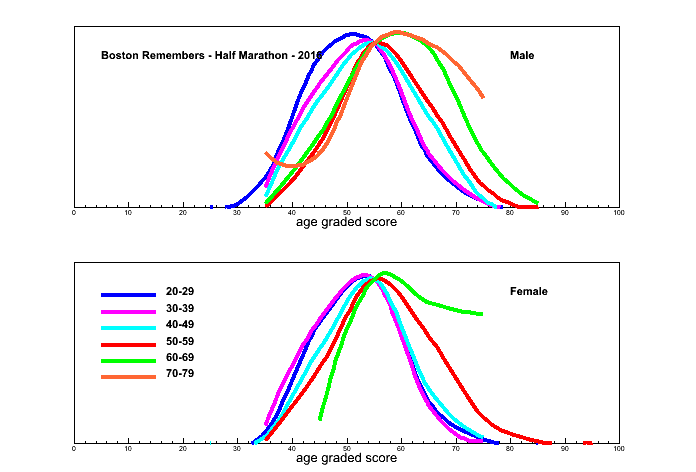
Fig 4. Distribution of Age Graded scores broken down by age and gender. The Brooklyn Half Marathon
for high resolution, *pdf version click here
![]()
Fig 5. Distribution of Age Graded scores for the Beach To Beacon 10k.
for high resolution, *pdf version click here
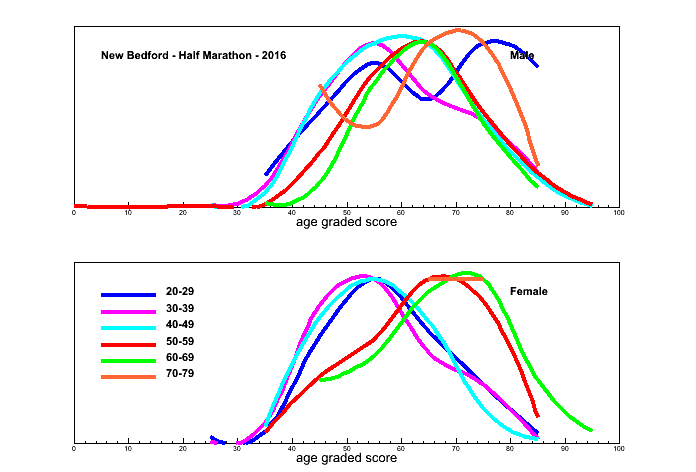
Fig 6. Distribution of Age Graded scores for the New Bedford Half Marathon.
for high resolution, *pdf version click here
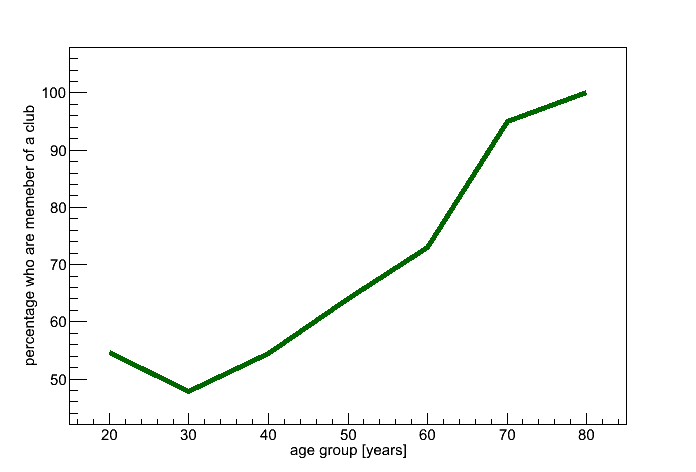
Fig 7. Percentage of runners (Brooklyn Half) who are memebers of a running club.
for high resolution, *pdf version click here
click on figure to get full size
- An Ras Mor 5K - 2016

- B.A.A. Half Marathon - 2015
- Beach To Beacon - 10k - 2016
- Boston Remembers - Half Marathon - 2016
- Brooklyn - Half Marathon - 2013
- New Bedford - Half Marathon - 2016

- Vermont City - Marathon - 2015