The basic idea is that the "Finish Time Profiles" (see figure 1) of all marathons are actually pretty similar, a skewed Gaussian, or "Skewed Normal Distribution". If I assum that the US Olympic Trials is the leading edge of this same distribution, can I infer what the race would have looked like if there was not aqualifing time?
In the article I fit the "Finish Time Profiles" to the following equation:

In this equation:
- t = time
- μ = mean time
- σ = width of distribution
- A = amplitude
- B & C = skew parameters

is similar to a Gaussian distribution, except the exponet of "4" instead of "2". I speculate that this is because we should think of the distrubution of athlets interms of "power" (energy per time) instead of velocity (distance per time). But no proof.
The left hand part: 
is just a polynominal. I wrote it in this form so "A" is amplitude and "B & C" are the skew parameters.
click on figure to get full size
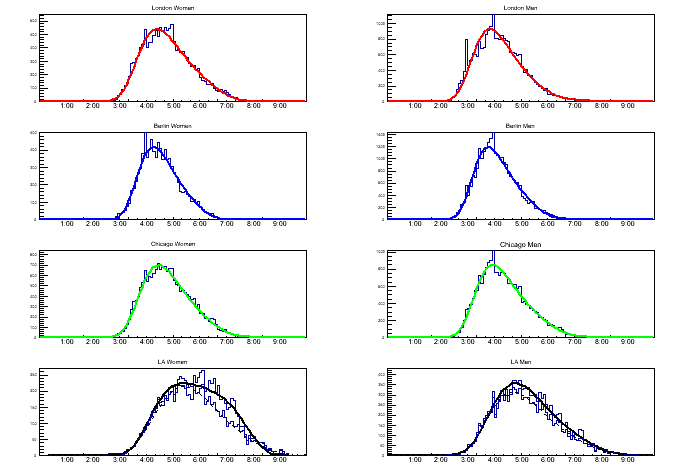
Fig 1. The finish time profile for the London, Berlin, Chicago and Los Angeles Marathons. The width and the average vary with the difficulty of the course and the weather. Berlin is famous as a fast course, and here you can see it is not just the leaders. LA has a number of Middle School and High School student runners. If we remove them the profile (the lower, dotted curve) is much more like that of the other marathons.
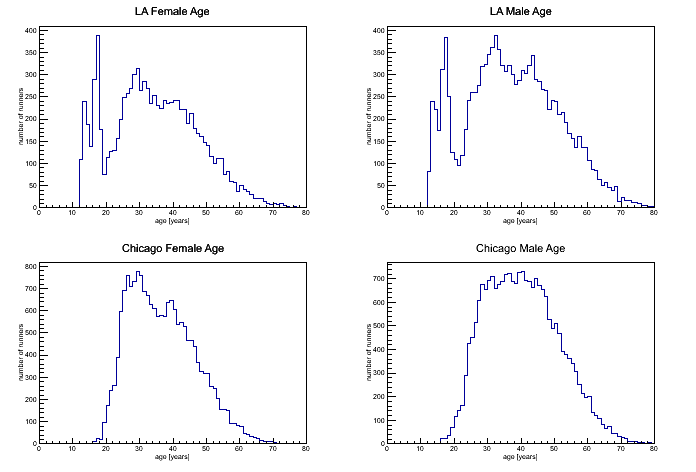
Fig 2. Age distribution for the LA Marathon and Chicago. You can see that “Student Run LA” profoundly changes the character of that marathon.
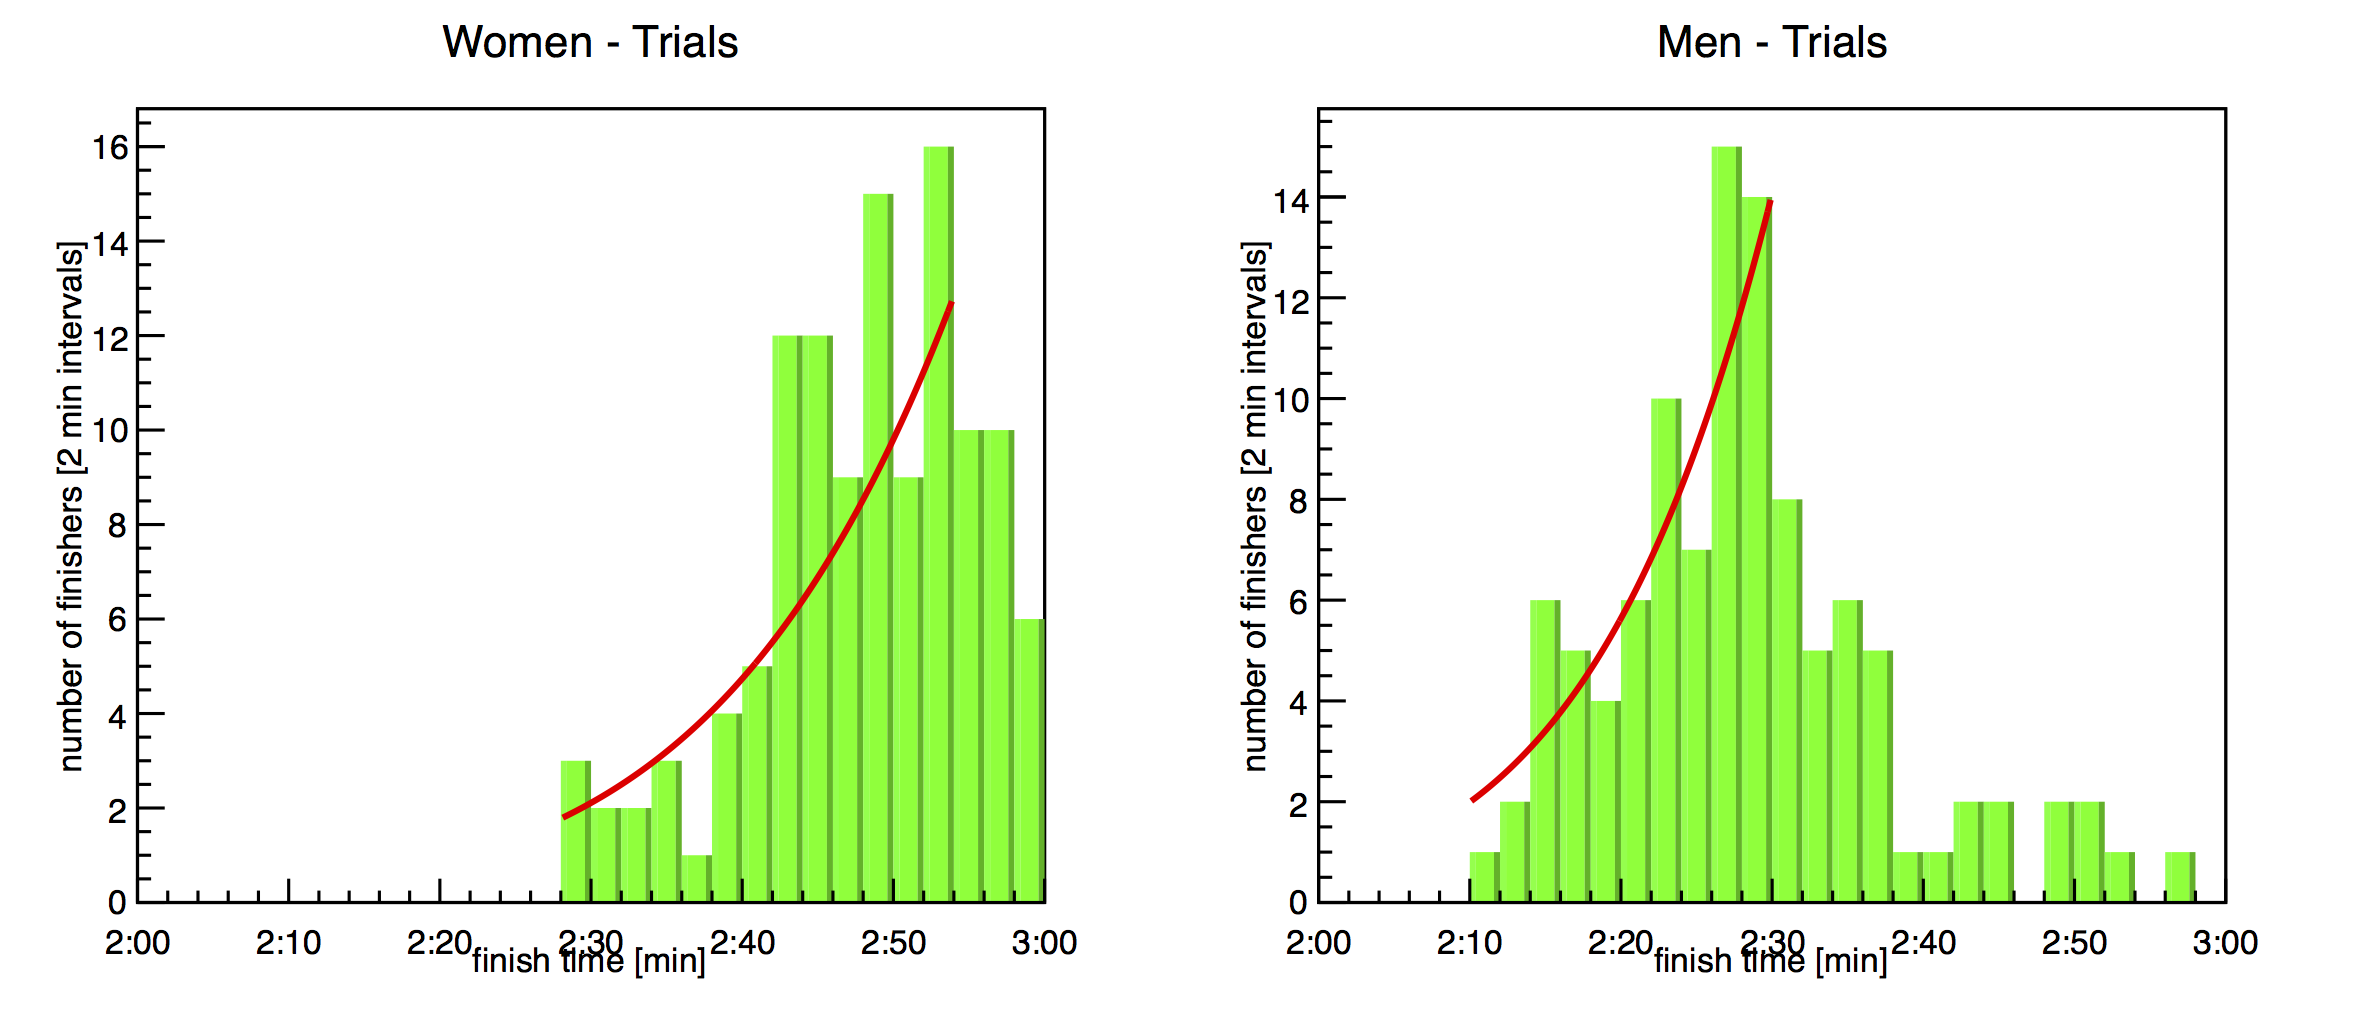
Fig 3. The finished time profile for the US Olympic Trials compared to the shape of the LA Marathon (minus the student runners). The best fit suggested scaling the LA field by a factor of 10 to 30, depending upon the range of time used in the fit.
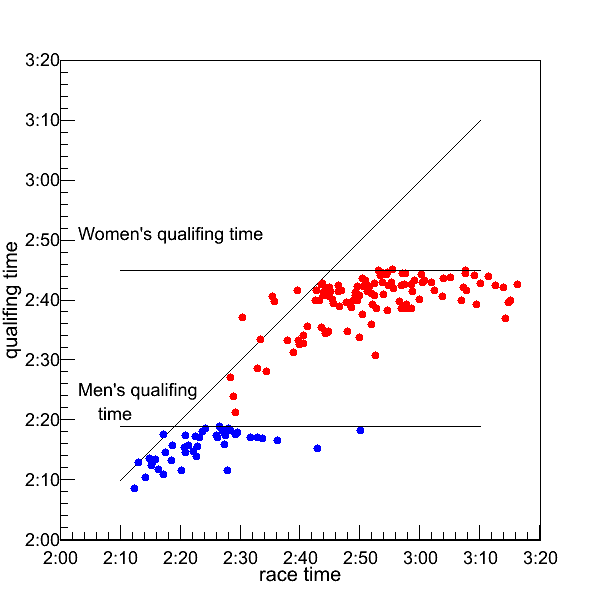
Fig 4. Race Times vs. Qualifying Times. There were 148 women and 108 men in the Trials, but only 114 women and 44 men had qualified with pervious marathon times. The rest had qualified with half marathon times. Of these runners only 5 women and 1 man ran faster at the trials then their qualifying times.
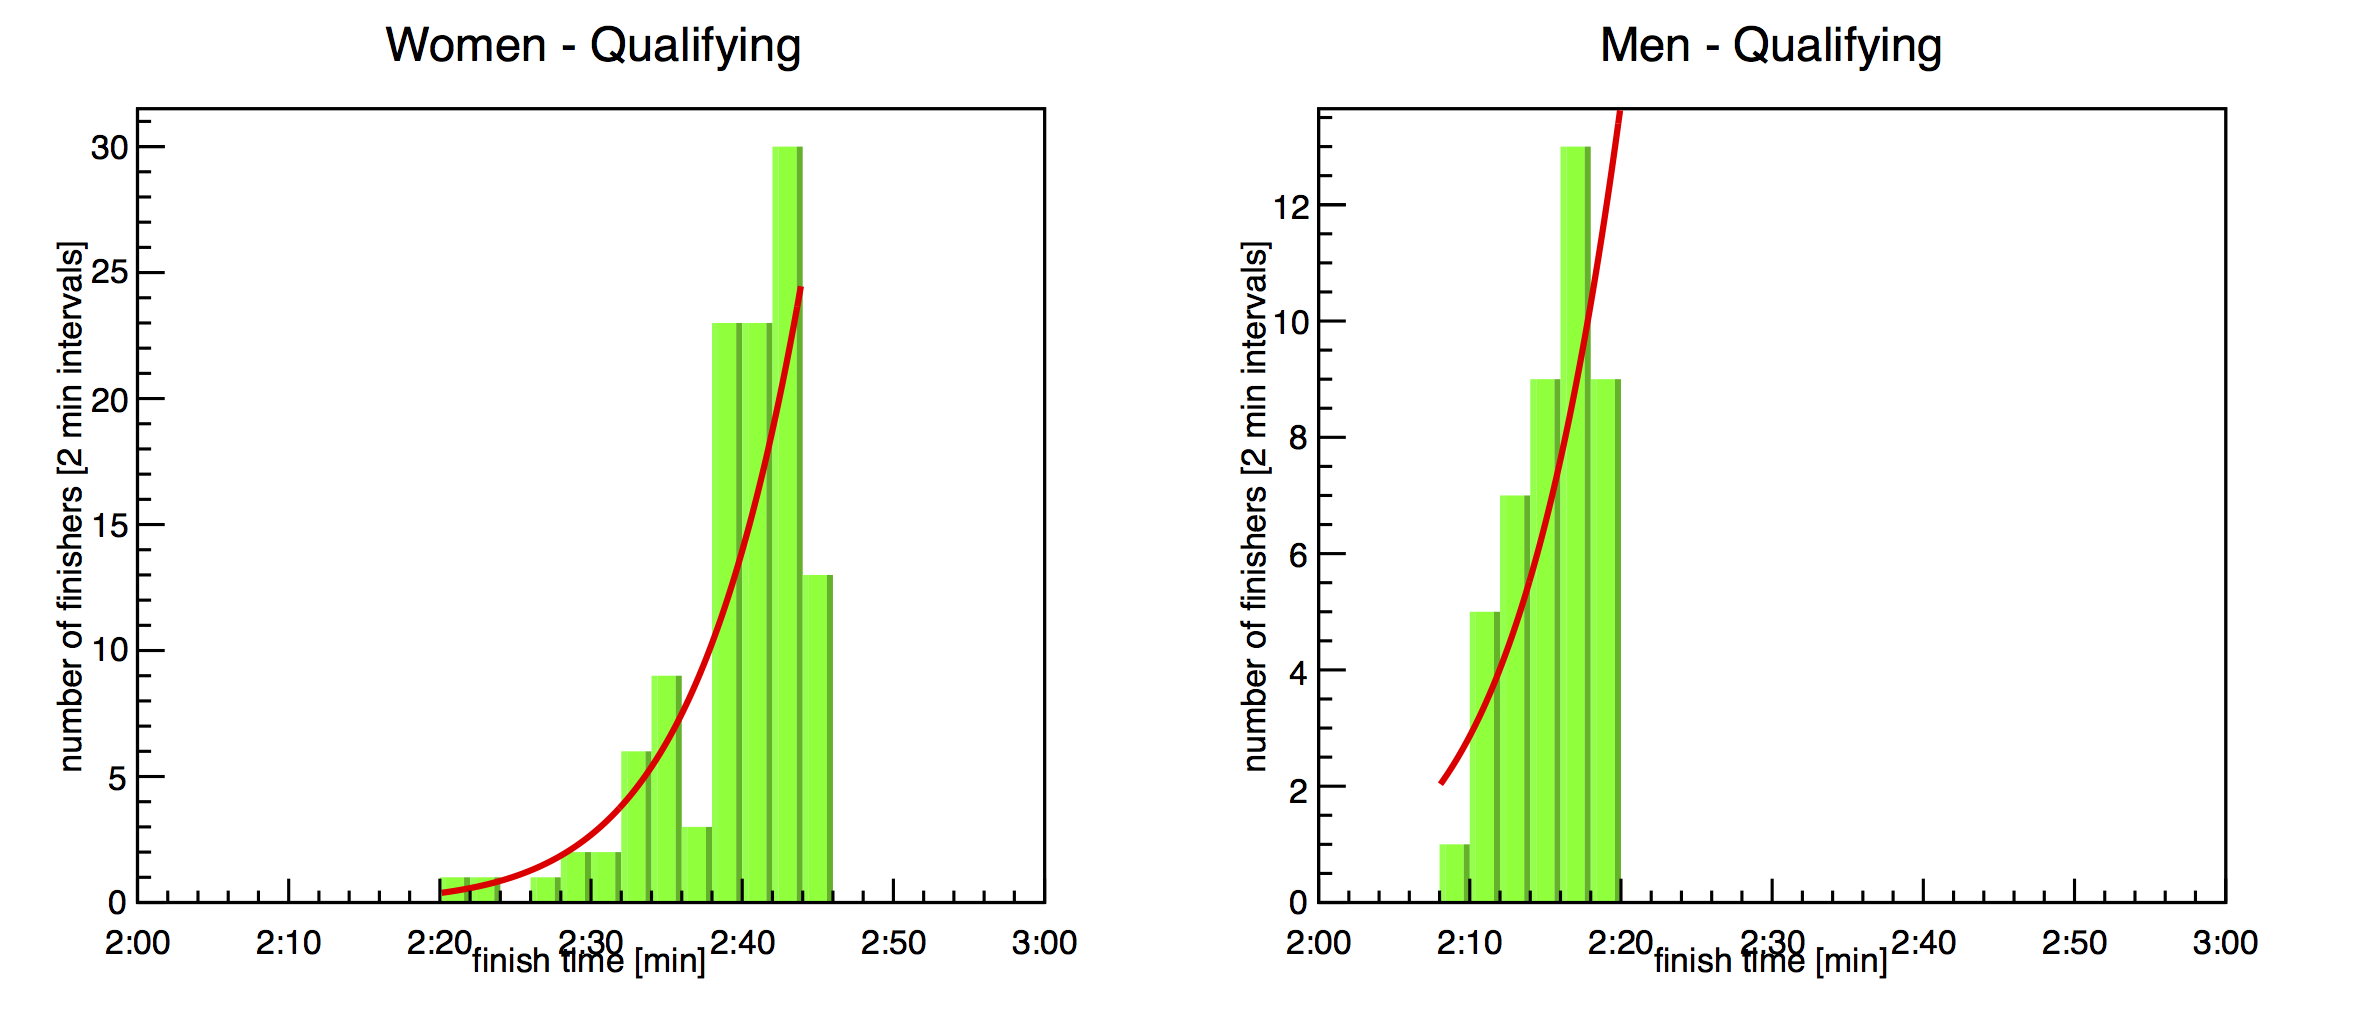
Fig 5. The finishing time profile for qualifying time compared to the Berlin Marathon. This suggest that the Trials looked like the lead edge of Berlin with 35 times as many runners.